

Tip of the Day 23: Phantom Curves: A Graphical Tutorial
I have mentioned a couple of times the “phantom” curves – those cavity pressure curves on the eDART that are not an actual sensor but are made up of the data from all of the sensors. Here are the main points and some graphics to go with
- The four curves end with cavity id’s #High, #Low, #Avg and #Rng. These #Avg is “Average” and #Rng is “Range”.
- Each location creates a set of phantom curves for all sensors at that location. If you have several Post Gate and several End of Cavity sensors then the eDART will make Post Gate #High etc. and End of Cavity #High etc.
- The value as measured with the cursor at any point in time is the highest, lowest, average or range (High – Low) of all of the cavity sensors at that location at that time.
8 Cavities | + #High & #Low | #High and #Low | #High, #Low, #Avg | #High, #Low, #Rng |
|
|
|
|
|
Range with Balanced Cavities | Range with Blocked Cavity |
|
|
The remainder of this text describes the above in more detail.
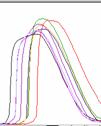
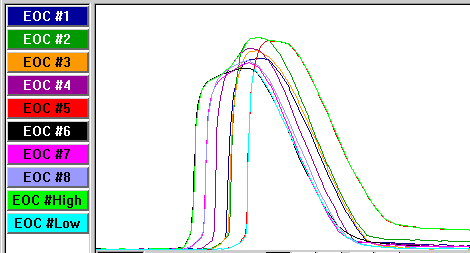
Multi Cavity Graph Showing All 8 Sensors
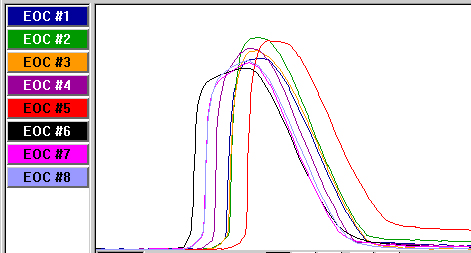
Adding High and Low.
Note that the bright green curve follows the highest sensor at any time but that the cavity that is highest can switch. Likewise for the low (cyan) curve
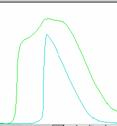
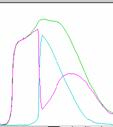
Showing Just High and Low and Removing the 8 Curves
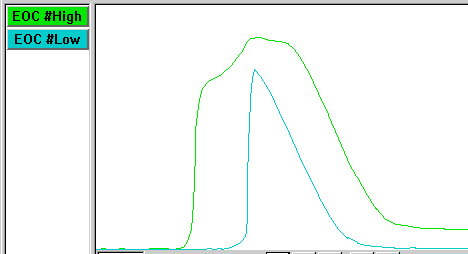
All of the other curves must lie within this envelope, even if you can’t see the details. This is most helpful with even more cavities (16 and above). Of course the #High and #Low can make some weird looking curves as some cavities rise up above others.
If you set the eDART to transfer on End of Cavity #High then it will transfer on the first sensor to reach that pressure. This prevents any sensor from getting too high. Conversely if you set the machine to transfer on End of Cavity #Low then all sensors will reach at least the V->P set point value. Of course if one blocks then you could flash the others. On the V->P Transfer tool you can use the “More” button to set another value on End of Cavity #High for a backup.
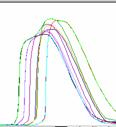
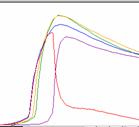
Adding Average
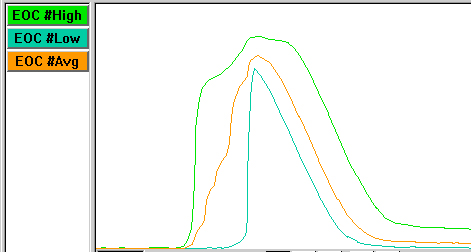
As you would expect the End of Cavity #Avg follows down the middle of the #High and #Low. There is some evidence that setting the V->P transfer to transfer on #Avg can produce the most consistent parts. As with #Low you should set a #High backup if you use #Avg for transfer.
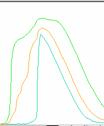
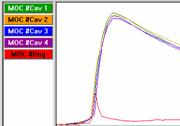
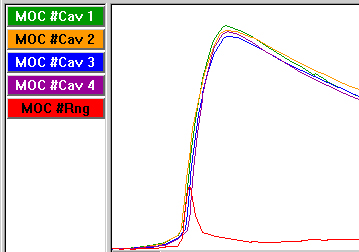
The “Range” Curve
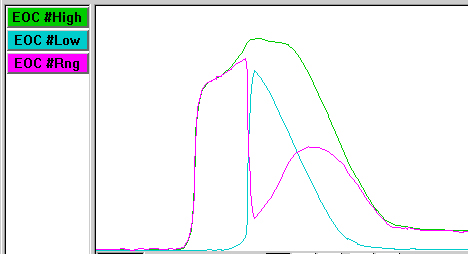
As mentioned at the beginning this is the instantaneous difference between the high and low curves. Of course when #Low is zero (some sensor has not seen pressure yet) then the #Rng curve follows only the #High curve.
This is a seldom used curve but can be useful for stopping the press early if a cavity blocks. Suppose the cavities are balanced most of the time but once in a while one blocks causing the others to flash. You can set the front page V->P transfer to #Avg and then set a backup on #Rng at a very much lower value. If the cavities being to spread (one is very late) then this can stop the press.
The above example is not particularly good because the cavities are so out of balance. Here is another one in which they are mostly balanced and the #Rng curve does not get very high. The left curve is a normal shot and the right curve is a random blockage on Mid Cavity #4
 | 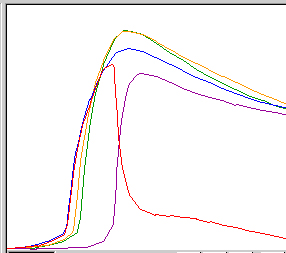 |
A backup transfer on Mid Cavity #Rng could have been used to stop the press to prevent the others from going higher. Though it was not a big issue on this mold.