

Tip of the Day 78: What is “Stability”?
Tip #77 states “Always wait for the process to be stable 20 shots before adding alarms.” This is also true for setting templates, testing parts for quality etc. So the question I hear next is “What do you mean by a ‘stable’ process?”
The short answer is: A stable process is one in which variation is mostly random but not too wild.
Breaking that apart:
Non-random variation show up as patterns in summary values on the summary graph. You can easily see such patterns with your eye. These include cyclic variation, upward trends, downward trends and repeating steps (pictures below). Anything not random has some cause that should be fixed or the process will not be consistent. Or, if the non-random variation is within limits you can live with it; knowing of course that it could get worse.
Some random variation must be accepted, more in some processes than in others. In general we look for a small coefficient of variation on whatever summary value is important (cycle integrals giving a general overview of the process).
Wildly random variation is unstable because each shot affects the next one, driving it to some other extreme. You can observe this sort of instability while riding with several young children in a car on a long trip. Nuclear reactions gone critical also come to mind.
Note that a process can appear stable if you just look at it over a short time. Sometimes if you view it over a longer period you will see a trend.
In any case, if you see something with a pattern or wild variation you should pause and not make any conclusions or decisions until you stabilize the process to an acceptable level. For example don’t do a correlation study or try to set alarms if the mold temperature is continuously rising.
Here are some graphical examples of stability and instability. If you find it rather long, just look at the pictures. These are just different stories showing how instability can appear in the real world.
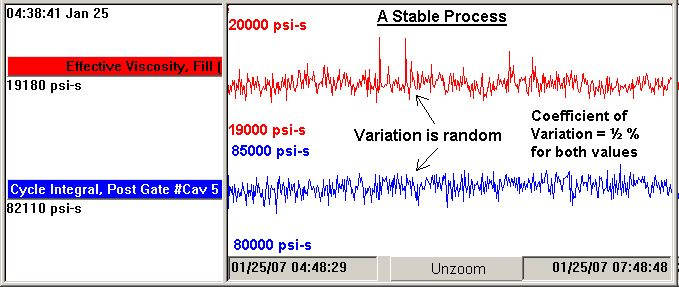
A Stable Process
Here is an essentially stable process. The variations show no pattern to them. The viscosity has a couple of interesting events but in the main it is stable for the 3 hours shown – no upward, downward or cyclical trends. Plus the variation is small relative to the average value of each.
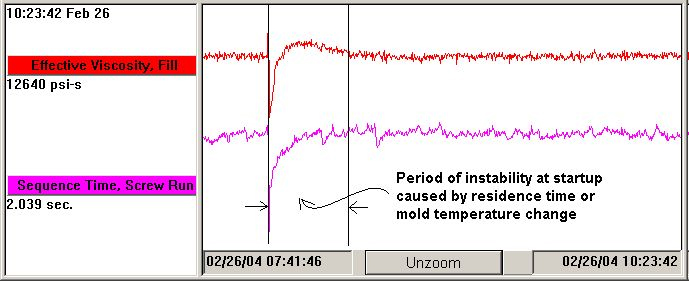
Process Unstable at Startup
This is typical of what happens when a cycle is interrupted. It takes a period of time for the process to stabilize. Even if the parts are acceptable the process is not stable for about 25 minutes. This is a large, 128 cavity closure mold.
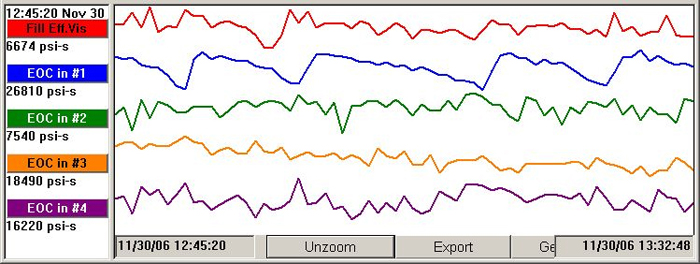
Unstable Cyclic Process Data on One Cavity
In this case cavity # 1 has a changing cycle integral that has a definite cyclic pattern. The human eye picks this up well. The level of variation creates a coefficient of variation of about 3%.
Are all the parts good? Perhaps. But what if I sampled several parts in a row and measured them? Depending on when they are sampled they could all appear large (if I sampled at the peaks), small (sampling at the minimums) or variable (sampling all over). This is why it is important to find the causes of such patterns and to stabilize before measuring. In this case the cause was a mold temperature controller oscillating up and down 5 °F.
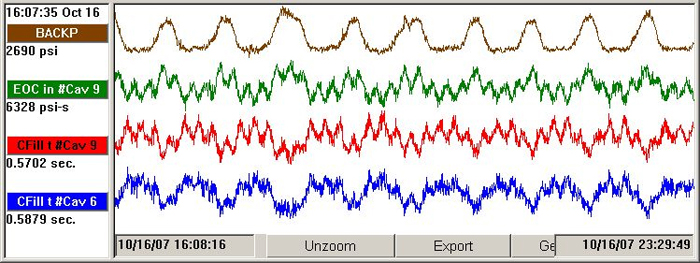
Multiple Cyclic Variation
In this example the varying backpressure (2300 to 2700 psi) is effectively causing a variation in shot size. The time to fill the cavities (CFill t) varies with the backpressure. On top of that there is a faster (and smaller) variation of unknown cause. On this process it was quite difficult to make repeatable parts.
Cyclic Variation with Varying Periods
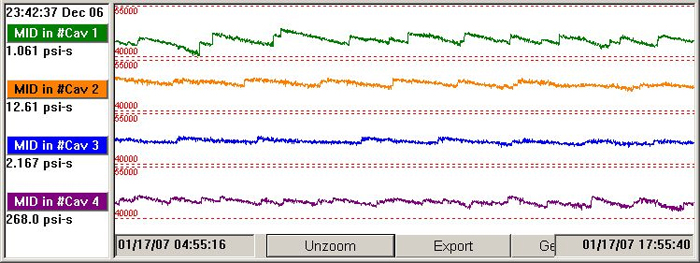
Not all cyclic patterns have equal time periods. Here is one in which each cavity has its own time period. The cycles are trends with sudden steps at the end of each trend. This is also known as a “saw tooth” shape. We think the hot runner tips are clogging up slowly and then, due to higher pressure, suddenly releasing the debris and then flowing smoothly for a while.
In this case most of the instability stayed within set alarm limits. However the pattern itself was a warning to the customer to try to find a cause before something failed entirely (which it eventually did).
Short Term Stability – Long Term Instability
In the first shot below you see about 2 hours of data. There are no visible patterns and the data looks random. One could conclude that this is a stable process.
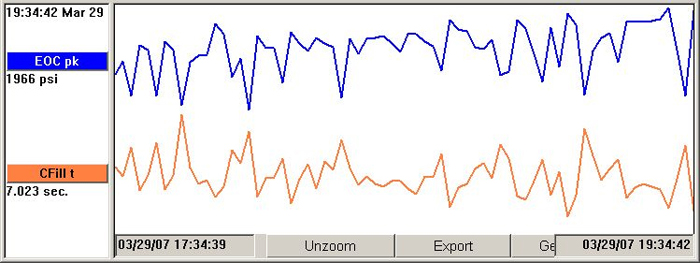
However, being a very large mold (30 tons?) the temperature of the steel is steadily increasing. Thus the process is not stable over a 16 hour period.
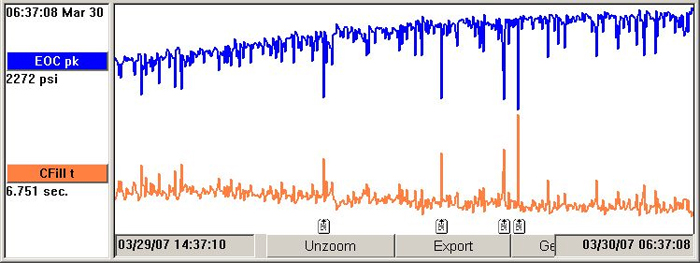
During that period the increased temperature made the mold easier to fill. So the cavity fill times decreased from 7.6 to 6.6 seconds and the end of cavity peaks increased from 1400 psi to 2300 psi. The random events with the notes on them are short shots.
Although the process looked stable at first it turned out to not be stable. In this case there was no way to stabilize the temperature so we instituted cavity pressure control at the end of the cavity to stabilize the part (fill every part without flashing) even with unstable temperature.