Tip of the Day 166: Correcting Phantom Curve Confusion
You may recall that we explained “phantom” curves in the eDART™ in tip #23. These are the curves ending with the cavity identifiers #Avg, #High, #Low and #Rng. At any instant in time the value of these curves is the average, high, low or range of all curves at a location.
Cycle Integrals
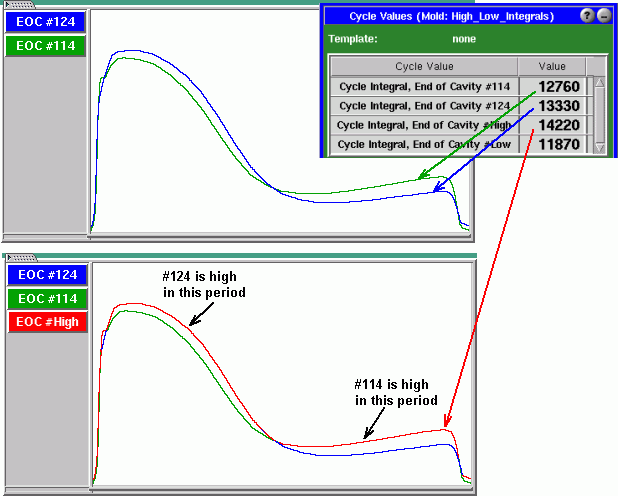
Some customers have been using alarms on Cycle Integral / End of Cavity #High or #Low. If the curves are similar enough to each other this is a simple way of reducing the number of alarm rows (tip # 162). However one customer was concerned that the Cycle Integral / End of Cavity #High value was higher than any cycle integral of the individual curves. Consider this pair of curves†:

Because the #High curve is the instantaneous value at each sample time it is larger than either of the two curves that make it up. Thus the integral (area under the curve) for #High is greater than the integral either #114 or #124.
Range of Peak or Peak of Range
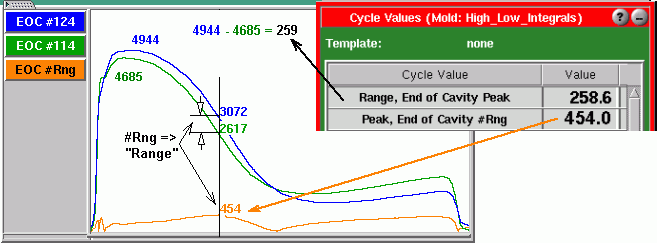
The “#Rng” curve is the instantaneous difference between the high and low curves as shown here:

The “Peak” of that curve can occur anywhere and does not relate at all to the peaks of the individual curves. In this instance the greatest spread in the curves is on the down-slope, not near the peaks. Often the peak of the #Rng curve is early in the cycle if the cavity fill times differ. The little slice of time when one cavity has no pressure and the other is rising fast creates a peak on the #Rng curve.
Alarms or warnings set on the #Rng curve peak or integral can be used to detect a general spread in the behavior of the different cavities.
The eDART also computes a “Range” summary value which is not the #Rng curve. The “Range / End of Cavity Peak” is the difference between the highest peak and lowest peak for all of the End of Cavity curves. As shown above it does not relate to #Rng at all.
† Mold deflection caused the reversal of the curves in this particular mold

