
Tip of the Day 79: Looking for Change
Tip # 78 explains trends and cycles in terms of stability. This leads to the next concept: A stable process can change and it is important to notice it and understand it.
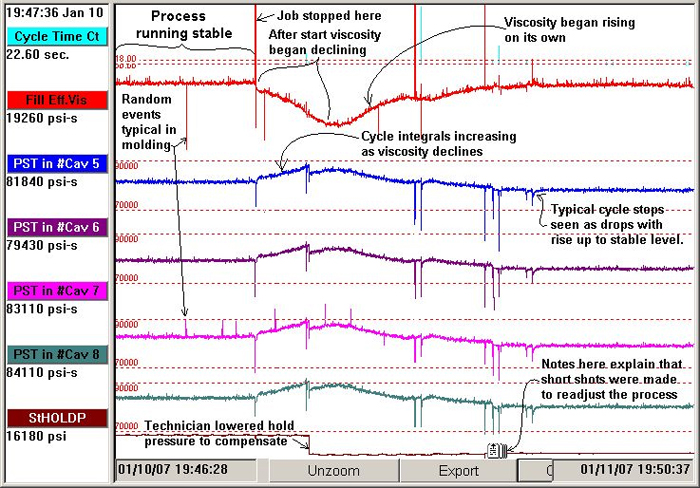
Below is an example showing 24 hours of data with a variety of different events. Typical events seen in summary data include:
Drop-outs or spikes: Usually caused by cycle stops with re-stabilization but sometimes just a random event or randomly blocked gates. The Sequence Time / Cycle Time always shows a spike
Trends downward or upward in an otherwise stable process
Sudden steps up or down in a summary value.
Each of these are indicators of something changing and therefore the parts will be different in some way.
Short Course in Graph Interpretation
Flat(ish) Line:
At the start of this period the process is stable: no cyclical shapes or trends appear the data.
Spikes:
Occasionally there is a spike on cavity # 7 integral. These are not uncommon in injection molding are the reason for using in-cavity measurement for containment.
Spikes in Cycle Time:
Whenever a cycle stops a spike in the cycle time shows how long it was stopped.
Drop Outs:
Then when the process starts several parts are produced that are out of specification. This is due to the mold cooling about 40°F and the a long residence time degrading the material. These can show up as drop-outs and sometimes as spikes.
Drop outs are also caused by random events like stuck gates or unmelted pellets.
Downward Trend:
In this example the material feed was changed to a new lot. For some reason the further the material feed got into the new lot the lower the viscosity. This caused the integrals to trend upwards – lower viscosity => easier to fill and pack.
Step in Data:
A technician noticed the integrals crossing the alarm settings (cavity # 8) and the machine throwing parts away. Not understanding the material change he re-adjusted the process to bring the integrals back into line by lowering the hold pressure. This shows as a step in the Average Value / Stable Hold Pressure (brown curve).
Generally steps indicate that an operator changed something. Occasionally a step occurs when something breaks (e.g. a core pin). When barrel heaters or mold temperature controls go awry you usually see a trend.
Notes:
Notes are also part of the summary data. If technicians are careful to enter them they will help to interpret what happened at these various events.